


The total value of China's imports and exports reached $1.7607 trillion in 2006, up 23.8 percent over the previous year. Of this total, the value of exports was $969.1 billion, up 27.2 percent, and that of imports was $791.6 billion, up 20.0 percent. China had a trade surplus of $177.5 billion in 2006, an increase of $75.5 billion over the previous year.
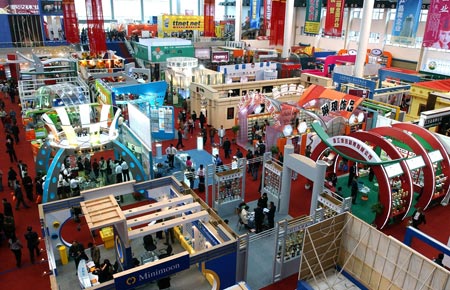 |
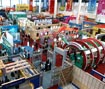
Yiwu in Zhejiang Province is an important trading center of consumer commodities in the world. Pictured is the China Yiwu International Commodities Fair.
Total Value of Imports and Exports and the Growth Rates in 2006
Item Value ($100m) Increase over 2005 (%) Total imports and exports 17607 23.8 Exports 9691 27.2 Of which: General trade 4163 32.1 Processing trade 5104 22.5 Of which: Mechanical and electrical products 5494 28.8 Hi-tech products 2815 29 Of which: State-owned enterprises 1913 13.4 Foreign-funded enterprises 5638 26.9 Other enterprises 2139 43.6 Imports 7916 20 Of which: General trade 3332 19.1 Processing trade 3215 17.3 Of which: Mechanical and electrical products 4277 22.1 Hi-tech products 2473 25.1 Of which: State-owned enterprises 2252 14.2 Foreign-funded enterprises 4726 22 Other enterprises 938 24.4 Trade surplus 1775 Of which: General trade 831 Processing trade 1889 Other trade -945
Imports From and Exports to Major Countries and Regions and the Growth Rates in 2006
|
|
Exports ($100m) |
Increase over 2005 (%) |
Imports ($100m) |
Increase over 2005 (%) |
|
European Union ASEAN |
2035 1820 1554 916 713 445 207 158 |
24.9 26.6 24.8 9.1 28.8 26.8 25.3 19.8 |
592 903 108 1157 895 898 871 176 |
21.8 22.7 -11.8 15.2 19.4 16.9 16.6 10.5 |
The year 2006 witnessed the establishment of 41,485 enterprises with foreign direct investment, down 5.8 percent year on year. Total paid-in foreign capital reached $69.47 billion, down 4.1 percent. Of the total foreign direct investment actually utilized, the manufacturing sector accounted for 57.7 percent; the real estate sector, for 11.8 percent; the financial sector, for 9.7 percent; leasing and business services, for 6.1 percent; and transportation, warehousing and postal services, for 2.9 percent.
Foreign Direct Investment and the Growth Rates by Sectors in 2006
|
Sector |
Contracted Project (number) |
Increase over 2005 (%) |
Actually utilized investment ($100 m) |
Increase over 2005 (%) |
|
Total |
41485 |
-5.8 |
694.7 |
-4.1 |
|
Farming, forestry, animal husbandry and fishery |
951 |
-10.1 |
6 |
-16.5 |
|
Mining and quarrying |
208 |
-17.5 |
4.6 |
29.7 |
|
Manufacturing |
24790 |
-14.3 |
400.8 |
-5.6 |
|
Production and supply of electricity, gas and water |
375 |
-3.9 |
12.8 |
-8.1 |
|
Construction |
352 |
-23 |
6.9 |
40.4 |
|
Transportation, warehousing, postal and telecommunications services |
665 |
-9.4 |
19.8 |
9.5 |
|
Information transmission, computer service and software |
1378 |
-7.7 |
10.7 |
5.5 |
|
Wholesale & retail trade |
4664 |
79.3 |
17.9 |
72.3 |
|
Accommodation & catering services |
1060 |
-12.2 |
8.3 |
47.8 |
|
Banking |
64 |
10.3 |
67.4 |
-45.2 |
|
Real estate development |
2398 |
13.1 |
82.3 |
51.9 |
|
Leasing and business services |
2885 |
-3.2 |
42.2 |
12.8 |
|
Scientific research, technical services and geological prospecting |
1035 |
11.8 |
5 |
48.1 |
|
Water conservancy, environmental protection and public facilities management |
132 |
-5 |
2 |
40.4 |
|
Services to households and other services |
236 |
-28.3 |
5 |
93.9 |
|
Education |
27 |
-47.1 |
0.3 |
65.6 |
|
Health, social security and social welfare |
20 |
-9.1 |
0.2 |
-61.4 |
|
Culture, sports and recreation |
241 |
-11.4 |
2.4 |
-21 |
|
Public management and social organization |
4 |
|
0.07 |
91.1 |
In 2006, the overseas direct investment (non-financial investment) by Chinese investors amounted to $16.1 billion, a year-on-year increase of 31.6 percent.
The accomplished business revenue through contracted overseas engineering projects reached $30 billion, up 37.9 percent, and the business revenue through overseas labor contracts was $5.4 billion, up 12.3 percent.