II. Comparative Analysis of China Top 500 and Global Top 500
 0
0 


The operating revenue of the World's Top 500 amounted to US$23.0851 trillion, a decline of 8.3 percent over the previous year. Their net profit reached US$960.5 billion, an increase of 16.8 percent over the previous year. Their total assets hit US$102.4537 trillion, an increase of 2.4 percent over the previous year. The threshold of the list was US$17.05 billion, down 8.2 percent from the previous year.
1. The Top 500 Chinese Companies grew much faster than the World's Top 500, further narrowing the gap.
Measured in dollars, the operating revenue of the Top 500 Chinese Companies increased by 9.9 percent over the previous year, net profit, 29 percent; and total assets 27.3, percent. Meanwhile, the World's Top 500 saw their operating revenue decrease by 8.3 percent from 2009; net profit grew by 16.8 percent; and total assets increased by 2.4 percent. It is obvious that the Top 500 Chinese Companies surpassed the World’s Top 500 in terms of these three indexes.
Due to the international financial crisis, the growth in operating revenue of the Top 500 Chinese Companies decreased by 9.2 percent from 2009, and that of the World's Top 500 is down by 14.9 percent. In terms of net profit, the Top 500 Chinese Companies regained a striking increase in 2010 after a slight decline in 2009. The World's Top 500 also rebounded significantly after last year's sharp decrease. The growth of total assets of the Top 500 Chinese Companies increased by 2.9 percent while that of the World's Top 500 saw a slight rebound following last year's slight decline. See Figure 5-1 for details.
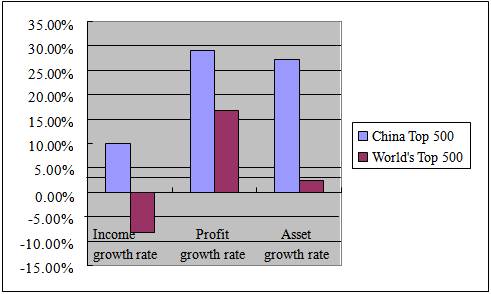
Figure 5-1. Growth indexes of Top 500 Chinese Companies and World's Top 500 Companies
The operating revenue of the Top 500 Chinese Companies reached US$4.0458 trillion; net profits hit US$220.2 billion; total assets amounted to US$13.3627 trillion. The operating revenue of the World’s Top 500 reached US$23.0851 trillion; net profits hit US$960.5 billion; total assets amounted to US$102.4537 trillion. The operating revenue, net profits and total assets of the Top 500 Chinese Companies in 2009 took up, respectively, 14.62 percent, 20.75 percent and 10.49 percent of those of the World's Top 500 Companies in 2009. The operating revenue, net profits and total assets of the Top 500 Chinese Companies in 2010 accounted for, respectively, 17.53 percent, 22.92 percent and 13.04 percent of those of the World's Top 500 Companies in 2010. All figures increased significantly over 2009. See Figure 5-2 for details.
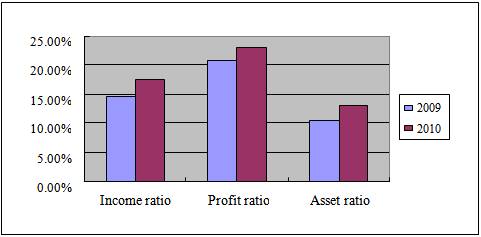
Figure 5-2. Top 500 Chinese Companies and World's Top 500 Companies across three indicators in 2009 and 2010
The threshold of the Top 500 Chinese Companies exceeded US$1.6 billion, which increased by 4.7 percent over 2009. The threshold of the 2010 World's Top 500 Companies almost reached US$17.1 billion, down 8.1 percent over 2009. Fifty companies among the Top 500 Chinese Companies in 2010 qualified for the World’s Top 500 Companies, but seven did not apply to be listed.
2. The Top 500 Chinese Companies were more profitable than the World's Top 500.
The average profit rate of income of the Top 500 Chinese Companies rose to 5.44 percent, 0.84 percent higher than 2009. The rate of the World's Top 500 Companies increased to 4.16 percent, 0.89 percent higher than 2009. The average profit rate of income of the Top 500 Chinese Companies surpassed that of the World’s Top 500 Companies for the second consecutive year.
Compared with the previous year, the average profit rate of assets of the Top 500 Chinese Companies decreased to 1.65 percent, down 0.02 percent. The rate of the World's Top 500 Companies increased to 0.94 percent, 0.12 percent higher than in 2009. The average profit rate of assets of the Top 500 Chinese Companies is more than that of the World's Top 500 Companies for the third straight year.
Compared with the previous year, the average profit rate of net assets of the Top 500 Chinese Companies increased to 9.4 percent, up 0.52 percent. The rate of the World's Top 500 decreased to 8.16 percent, down 0.07 percent. The average profit rate of net assets of the Top 500 Chinese Companies is greater than that of the World’s Top 500 for the second year. See Figure 5-3 for details.
The average rate of assets turnover of the Top 500 Chinese Companies was 0.30 times per year, while the rate for the World's Top 500 Companies was 0.23 time per year. In that respect, the Top 500 Chinese Companies have been surpassing the World’s Top 500 Companies for years.
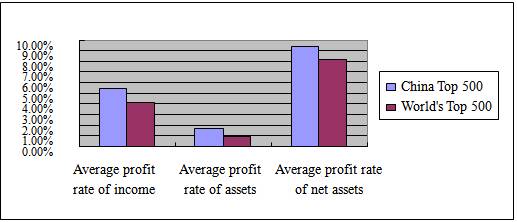
Figure 5-3. Efficiency index of Top 500 Chinese Companies and World's Top 500 Companies
3. Compared with the World's Top 500 Companies, the size distribution of the Top 500 Chinese Companies is more unbalanced.
Among the World's Top 500 Companies, the operating revenue of the top company is 24 times that of the last company. The operating revenue of the largest Chinese company is 125 times that of the last one. This illustrates that the size distribution of the Top 500 Chinese Companies is more unbalanced compared to that of the World's Top 500. The operating revenue of the top 100 Chinese companies accounted for 65 percent of the total. the operating revenue for the top 100 in the World's Top 500 was only 47 percent. As for those ranking between 101 and 200, their operating revenue took up 15 percent of the total in China and 21 percent of the total in the world.
Companies ranking between 201 and 300, 301 and 400, and 401 and 500 had operating revenues accounting for, respectively, 9 percent, 6 percent and 5 percent of the total in China and, respectively, 13 percent, 10 percent and 9 percent of the total in the world. Figure 5-4 shows that the distribution line of operating revenue of Top 500 Chinese Companies is steeper than that of the World's Top 500 Companies.
Figure 5-4. Distribution line of operating revenue of Top 500 Chinese Companies and World's Top 500 Companies in 2010
4. There is a wide gap in labor productivity between Top 500 Chinese Companies and the World's Top 500 Companies.
Labor productivity is measured by income per capita and profit per capita. The income per capita of the World's Top 500 Companies was US$402,000, down 9.1 percent from 2009, while their profit per capita was US$17,000, an increase of US$2,000 from 2009. The income per capita of the Top 500 Chinese Companies was US$148,000, an increase of US$5,000 over 2009, while their profit per capita was US$8,000, an increase of US$1,000 over 2009. The income per capita and profit per capita of the World's Top 500 Companies were, respectively, 2.7 and 2.1 times greater than those of the Top 500 Chinese Companies, leaving a wide gap for the latter to bridge. See Figure 5-5 for details.
Figure 5-5. Comparison of the income per capita and profit per capita of China Top 500 and?World's Top 500
?
|
Chapter I. |


