US data shows no underlying economic acceleration under Trump
- By John Ross
 0 Comment(s)
 Print
Print E-mail China.org.cn, May 13, 2018


Given President Trump's tax cuts, and his claim that he will strongly accelerate the U.S. long term annual average growth rate to 4 percent, or even higher, considerable attention is necessarily focusing on the latest U.S. GDP figures. Almost simultaneously the IMF published its new five-year prediction for U.S. economic growth. Taking these together therefore provides a significant opportunity to assess whether President Trump's policies have succeeded in changing the growth path of the U.S. economy.
The GDP results
The latest U.S. data shows clearly that in his first year in office President Trump failed in his claim to fundamentally accelerate U.S. growth. U.S. GDP growth in 2017 was only 2.3 percent – scarcely above the long-term U.S. average growth rate of 2.2 percent. The recently published U.S. data now available for the first quarter of 2018 also shows no change in the underlying situation.
The U.S. GDP data shows the U.S. economy proceeding on a very predictable track of slow average growth but cyclical recovery from its extremely poor performance in 2016. In more detail:
? There is no sign of any acceleration in the medium/long term average annual U.S. growth rate, which remains at around 2.2 percent.
? In recovering from the extremely bad U.S. economic performance in 2016, when year on year growth fell to 1.2 percent in the second quarter, and growth for the entire year was only 1.5 percent, the U.S. is experiencing a normal cyclical upturn. U.S. growth in 2018, and possibly 2019, should continue to be above the long-term average rate before falling back in 2020-2021.
The fundamental data is shown in Figure 1. It shows that U.S. year on year growth has recovered from far below the average growth of only 1.2 percent in the second quarter of 2016 to above average 2.9 percent in the first quarter of 2018. This normal cyclical fluctuation, however, leaves the long-term average annual U.S. growth rate unchanged at slightly above 2 percent.
Figure 1
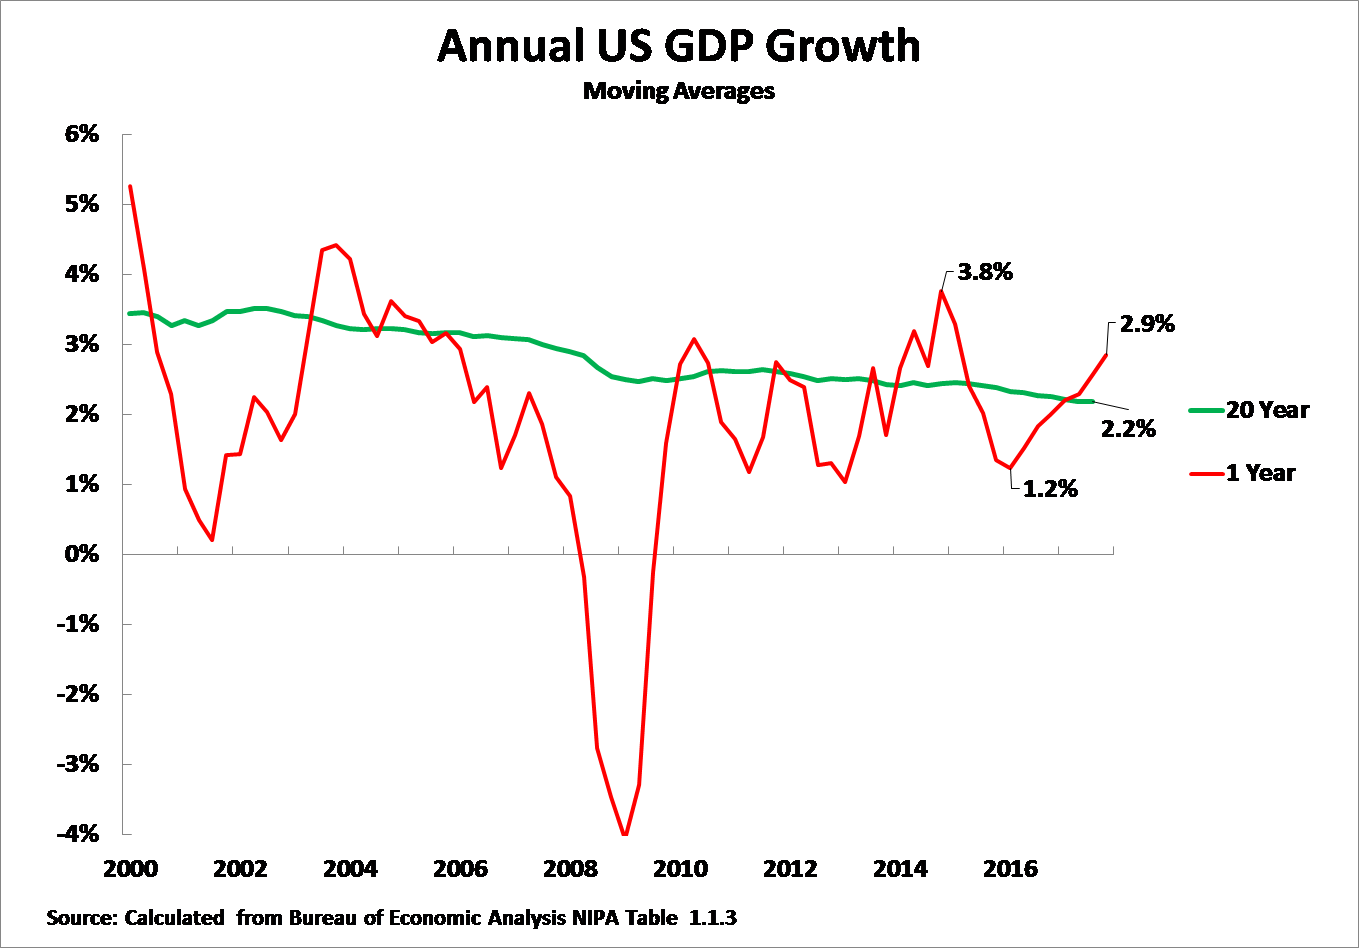
The medium/long-term U.S. rate of growth is clear from Table1. This shows that, using a moving average to eliminate purely short-term fluctuations, the three-year moving annual average of U.S. GDP growth is 2.1 percent, the five-year moving average is 2.3 percent, the seven-year moving average is 2.2 percent, and the 20-year moving average 2.2 percent. This consistency over both the medium-and longer-term means that the U.S. annual growth rate over anything except the very short term is extremely predictable (only a 10-year moving average shows a significantly lower growth rate, at 1.6 percent, due to the great impact of the 2008 international financial crisis).
Table1
| US Annual Average GDP Growth Rate to 1st Quarter 2018 | |
| 3-year moving average | 2.1% |
| 5-year moving average | 2.3% |
| 7-year moving average | 2.2% |
| 20-year moving average | 2.2% |
| Source: Calculated from US Bureau of Economic Analysis NIPA Table 1.1.3 | |
The consistency of this medium/long-term trend for U.S. growth is therefore clear. The medium/long-term average growth rate of the U.S. economy remains slightly above 2 percent – the 2.2 percent figure may be taken as a central figure. Given this medium/long-term average growth rate,the upturn of the U.S. economy in thefirstquarter of 2018 is a normal cyclical shift and there is no evidence of an acceleration in U.S. fundamental economic growth. Due to the extremely depressed U.S. growth during 2016, to counterbalance this while maintaining the overall slightly above 2percentaverage, U.S. growth during 2018-19 may be expected to be above the 2.2 percent medium/long-term average.
IMF
Turning to the newly released IMF projections for the U.S. economy for the next five years, published in its twice-yearly World Economic Outlook, which are shown in Figure 2. As may be seen the IMF projects the same overall pattern as in the analysis given above – i.e. relatively fast U.S. growth, above its medium/long-term average, in 2018-2019 followed by slowing growth in 2020-2023.
Figure 2
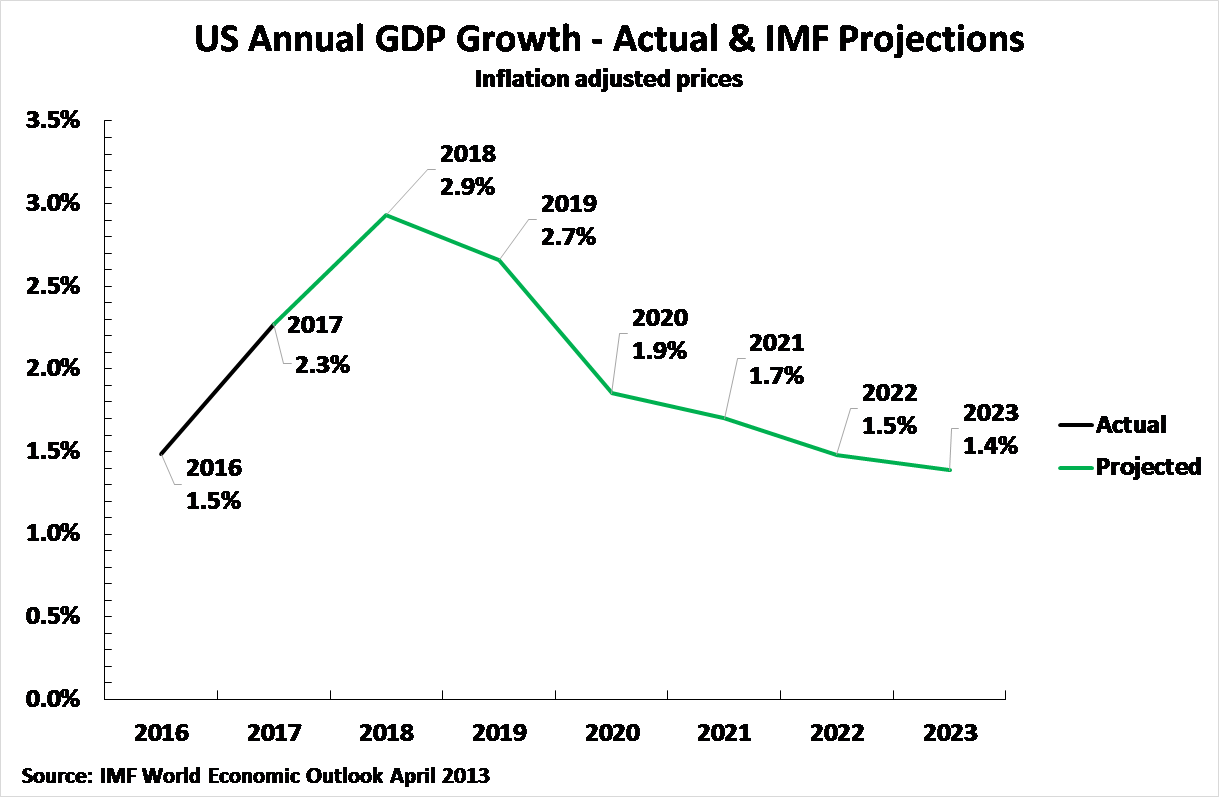
However, the overall U.S. growth projected by the IMF over the five-year period as a whole is significantly lower than the analysis above. The IMF projects only an average 1.8 percent annual average U.S. GDP growth between 2018 and 2023.
It is extremely unclear why the IMF projects this significant slowdown in the U.S. economy – the IMF provides no explanation for this. Analysis of the underlying features of the U.S. economy also indicate no reason to assume this. Analysis shows the main determinant of U.S. medium/long-term growth is U.S. net fixed investment – the correlation between the percentage of net fixed investment in U.S. GDP and U.S. GDP growth over an eight-year period is an extremely high 0.71.
However, at present, while the U.S. net fixed investment is low by historical standards, there is currently no sign of it significantly worsening. There is therefore no reason to believe there will be a substantial slowdown in U.S. medium/long-term economic growth.
The current author has on numerous occasions been critical of IMF projections for the U.S. economy which the facts have confirmed were excessively optimistic. In this case, however, while the IMF's projections are not impossible, they appear to be slightly pessimistic. Future upward revisions of IMF projections for the U.S. economy would therefore not necessarily represent an improvement in the actual situation of the U.S. economy but merely a correction of excessively negative current IMF projections.
Conclusion
Two conclusions follow from the above analysis:
? The upturn in the U.S. economy in 2018/19 is a normal business cycle development and there is no evidence from the U.S. data that Trump's policies have achieved any significant increase in the fundamental medium/long-term U.S. growth rate.
? Whether the IMF's prediction that the medium/long-term growth rate of the U.S. economy will fall to 1.8 percent is correct, or the present author's view that unless the level of U.S. fixed investment falls further, U.S. medium/long-term growth rate will remain slightly above 2 percent is correct, there is no indication of any fundamental increase in the U.S. growth rate. U.S. medium/long-term growth will continue to be slow at slightly above or slightly below 2 percent a year.
In summary, both the latest U.S. GDP data and the latest projections of the IMF indicate the U.S. economy is experiencing a normal cyclical upturn. President Trump has not achieved any increase in the medium/long-term growth rate of the U.S. economy.
John Ross, Senior Fellow, Chongyang Institute for Financial Studies, Renmin University of China, is a columnist with China.org.cn. For more information please visit:
http://www.ccgp-fushun.com/opinion/johnross.htm
Opinion articles reflect the views of their authors, not necessarily those of China.org.cn.


